ตำรายาของประเทศไทย
Thai Pharmacopoeia
สำนักยาและวัตถุเสพติด กรมวิทยาศาสตร์การแพทย์ กระทรวงสาธารณสุข
Bureau of Drug and Narcotic, Department of Medical Sciences, Ministry of Public Healthสำนักยาและวัตถุเสพติด กรมวิทยาศาสตร์การแพทย์ กระทรวงสาธารณสุข
Bureau of Drug and Narcotic, Department of Medical Sciences, Ministry of Public Health3.9 CHROMATOGRAPHIC SEPARATION TECHNIQUES
Interpretation of Chromatograms
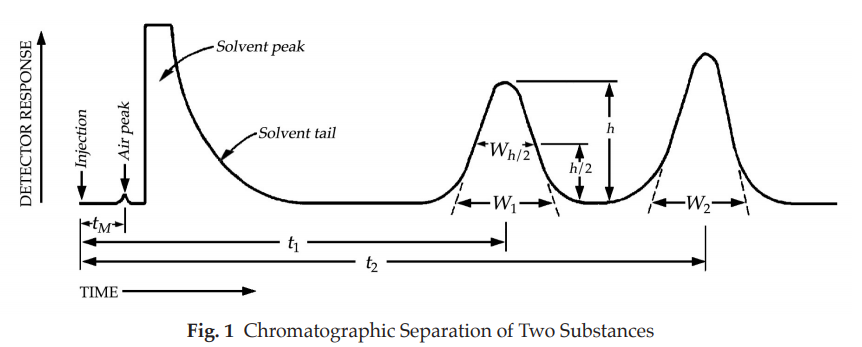
Figure 1 represents a typical chromatographic separation of two substances, 1 and 2, where t1 and t2 are the respective retention times. h, h/2, and Wh/2 are the height, the half-height, and the width at half-height, respectively, for peak 1. W1 and W2 are the respective widths of peaks 1 and 2 at the baseline. Air peaks are a feature of gas chromatograms and correspond to the solvent front in liquid chromatography.
Chromatographic retention times are characteristic of the compounds they represent but are not unique. Coincidence of retention times of a test and a reference substance can be used as a feature in construction of an identity profile but is insufficient on its own to establish identity. Absolute retention times of a given compound vary from one chromatogram to the next.
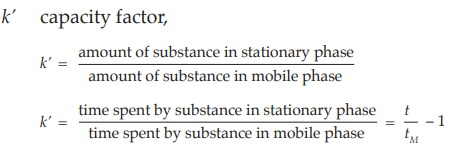
Because in most procedures there is no need to identify an unretained peak, comparisons are normally made in terms of relative retention times, Rr:

where t2, and t1 are retention times, measured from the point of injection, of the test and reference substances, respectively, determined under identical experimental conditions on the same column.
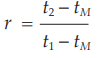
Other procedures may identify the peak position using the relative retention, r:
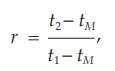
where tM is the retention time of a non-retained marker, which needs to be defined in the procedure.
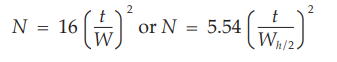
The number of theoretical plates, N, is a measure of column efficiency. For Gaussian peaks, it is calculated by the equation:
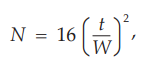
where t is the retention time of the substance and W is the width of the peak at its base, obtained by extrapolating the relatively straight sides of the peak to the baseline. The value of N depends on the substance being chromatographed as well as the operating conditions such as mobile phase or carrier gas flow rates and temperature, the quality of the packing, the uniformity of the packing within the column and, for capillary columns, the thickness of the stationary phase film, and the internal diameter and length of the column.
The separation of two components in a mixture, the resolution, R, is determined by the equation:
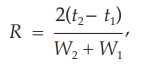
in which t2 and t1 are the retention times of the two components, and W2 and W1 are the corresponding widths at the bases of the peaks obtained by extrapolating the relatively straight sides of the peaks to the baseline.
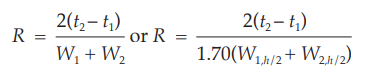
Where electronic integrators are used, it may be convenient to determine the resolution, R, by the equation:

and to determine the number of theoretical plates, N, by the equation:
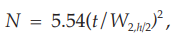
where Wh/2 is the peak width at half-height, obtained directly by electronic integrators. However, in the event of dispute, only equations based on peak width at baseline are to be used.
Peak areas and peak heights are usually proportional to the quantity of compound eluting. These are commonly measured by electronic integrators but may be determined by more classical approaches. Peak areas are generally used but may be less accurate if peak interference occurs. For manual measurements, the chart should be run faster than usual, or a comparator should be used to measure the width at half-height and the width at the base of the peak, to minimize error in these measurements.
For accurate quantitative work, the components to be measured should be separated from any interfering components. Peak tailing and fronting and the measurement of peaks on solvent tails are to be avoided.
Chromatographic purity tests for drug raw materials are sometimes based on the determination of peaks due to impurities, expressed as a percentage of the area due to the drug peak. It is preferable, however, to compare impurity peaks to the chromatogram of a standard at a similar concentration. The standard may be the drug itself at a level corresponding to, for example, 0.5 per cent impurity, or in the case of toxic or signal impurities, a standard of the impurity itself.
System Suitability
System suitability tests are an integral part of gas and liquid chromatographic methods. They are used to verify that the detection sensitivity, resolution, and reproducibility of the chromatographic system are adequate for the analysis to be done. The tests are based on the concept that the equipment electronics, analytical operations, and samples to be analyzed constitute an integral system that can be evaluated as such.
The detection sensitivity is a measure used to ensure the suitability of a given chromatographic procedure for the complete detection of the impurities in the Chromatographic purity or Related compounds tests by injecting a volume of a quantitation limit solution equal to that of the Test solution. Unless otherwise specified in the individual monograph, the quantitation limit solution may be prepared by dissolving the Drug Reference Substance in the same solvent as that used for the Test solution at a 0.05 per cent concentration level relative to the amount of drug substance in the Test solution for drug substances, and a 0.1 per cent level relative to the amount of drug substance in the Test solution for drug products. The signal-to-noise ratio for the drug substance peak obtained with the quantitation limit solution should be not less than 10.
The resolution, R, (Note All terms and symbols are defined in the Glossary of Symbols) is a function of column efficiency, N, and is specified to ensure that closely eluting compounds are resolved from each other, to establish the general resolving power of the system, and to ensure that internal standards are resolved from the drug. Column efficiency may be specified also as a system suitability requirement, especially if there is only one peak of interest in the chromatogram; however, it is a less reliable means to ensure resolution than direct measurement. Column efficiency is a measure of peak sharpness, which is important for the detection of trace components.
Replicate injections of a standard preparation used in the assay or other standard solution are compared to ascertain whether requirements for precision are met. Unless otherwise specified in the individual monograph, data from five replicate injections of the analyte are used to calculate the relative standard deviation, RSD, if the requirement is 2.0 per cent or less; data from six replicate injections are used if the relative standard deviation requirement is more than 2.0 per cent.
The symmetry factor (or tailing factor), T, a measure of peak symmetry, is unity for perfectly symmetrical peaks and its value increases as tailing becomes more pronounced (Fig. 2). In some cases, values less than unity may be observed. As peak asymmetry increases, integration and hence precision, becomes less reliable.
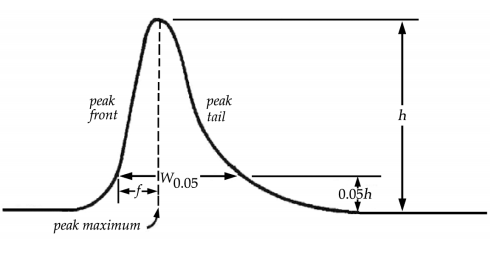
Fig. 2 Asymmetrical Chromatographic Peak
These tests are performed by collecting data from replicate injections of standard or other solutions as specified in the individual monograph. The specification of definitive parameters in a monograph does not preclude the use of other suitable operating conditions. Adjustments of operating conditions to meet system suitability requirements may be necessary.
Unless otherwise directed in the monograph, system suitability parameters are determined from the analyte peak.
Relative retention times may be provided in monographs for informational purposes only, to aid in peak identification. There are no acceptance criteria applied to relative retention times.
To ascertain the effectiveness of the final operating system, it should be subjected to suitability testing. Replicate injections of the standard preparation required to demonstrate adequate system precision may be made before the injection of samples or may be interspersed among sample injections. System suitability must be demonstrated throughout the run by injection of an appropriate control preparation at appropriate intervals. The control preparation can be a standard preparation or a solution containing a known amount of analyte and any additional materials useful in the control of the analytical system, such as excipients or impurities. Whenever there is a significant change in equipment or in a critical reagent, suitability testing should be performed before the injection of samples. No sample analysis is acceptable unless the requirement of system suitability have been met. Sample analyses obtained while the system fails system suitability requirements are unacceptable.
Adjustment of Chromatographic
Conditions The extent to which the various parameters of a chromatographic test may be adjusted to satisfy the system suitability criteria without fundamentally modifying the methods are listed below for information. The chromato-graphic conditions described have been validated during the elaboration of the monograph. The system suitability tests are included to ensure the separation required for satisfactory performance of the test or assay. Nonetheless, since the stationary phases are described in a general way and there is such a variety available commercially, with differences in chromatographic behaviour, some adjustments of the chromatographic conditions may be necessary to achieve the prescribed system suitability requirements. With reverse-phase liquid chromatographic methods, in particular, adjustment of the various parameters will not always result in satisfactory chromatography. In that case, it may be necessary to replace the column with another of the same type (e.g., octadecylsilyl silica gel) which exhibits the desired chromatographic behaviour.
For critical parameters the adjustments are defined clearly in the monograph to ensure the system suitability.
Multiple adjustments which may have a cumulative effect in the performance of the system are to be avoided.
Thin-layer Chromatography and Paper Chromatography
COMPOSITION OF THE MOBILE PHASE; pH OF THE AQUEOUS COMPONENT OF THE MOBILE PHASE; CONCENTRATION OF SALTS The adjustments can be made as described under High-pressure liquid chromatography.
APPLICATION VOLUME The application volume can be adjusted to 10 to 20 per cent of the prescribed volume if using fine particle size plates (2 to 10 μm).
MIGRATION DISTANCE The migration distance of the solvent front is to be not less than 50 mm or 30 mm on high-performance plates.
High-pressure Liquid Chromatography
COMPOSITION OF THE MOBILE PHASE The following adjustment limits apply to minor components of the mobile phase (specified at 50 per cent or less). The amount(s) of these component(s) can be adjusted by ±30 per cent relative. However, the change in any component cannot exceed ±10 per cent absolute (i.e., in relation to the total mobile phase), nor can the final concentration of any component be reduced to zero. Adjustment can be made to one minor component in a ternary mixture. Examples of adjustments are given below.
Specified ratio of 50:50 Thirty per cent of 50 is 15 per cent absolute, but this exceeds the maximum permitted change of ±10 per cent absolute in either component. Therefore, the mobile phase ratio may be adjusted only within the range of 40:60 to 60:40.
Specified ratio of 2:98 Thirty per cent of 2 is 0.6 per cent absolute. Therefore, the maximum allowed justment is within the range of 1.4:98.6 to 2.6:97.4.
Specified ratio of 60:35:5 For the second component, 30 per cent of 35 is 10.5 per cent absolute, which exceeds the maximum permitted change of ±10 per cent absolute in any component. Therefore, the second component may be adjusted only within the range of 25 per cent to 45 per cent absolute. For the third component, 30 per cent of 5 is 1.5 per cent absolute. In all cases, a sufficient quantity of the first component is used to give a total of 100 per cent. Therefore, mixture ranges of 50:45:5 to 70:25:5 or 58.5: 35:6.5 to 61.5:35:3.5 would meet the requirement.
pH OF THE AQUEOUS COMPONENT OF THE MOBILE PHASE The pH of the aqueous buffer used in the preparation of the mobile phase can be adjusted to within ±0.2 units of the value or range specified, or ±1.0 units when neutral substances are to be examined.
CONCENTRATION OF SALTS The concentration of the salts used in the preparation of the aqueous buffer used in the mobile phase can be adjusted to within ±10 per cent, provided the permitted pH variation is met.
DETECTOR WAVELENGTH No adjustment permitted.
STATIONARY PHASE --- column length: ±70 per cent,
--- column internal diameter: ±25 per cent,
--- particle size: maximal reduction of 50 per cent, no increase permitted.
FLOW RATE The flow rate can be adjusted by as much as ±50 per cent.
COLUMN TEMPERATURE The column temperature can be adjusted by as much as ±10º. Column thermostating is recommended to improve control and reproducibility of retention time.
INJECTION VOLUME The injection volume can be reduced as far as is consistent with accepted precision and detection limits.
Gas Chromatography
STATIONARY PHASE --- column length: ±70 per cent,
--- column internal diameter: ±50 per cent,
--- particle size: maximal reduction of 50 per cent, no increase permitted,
--- film thickness: –50 per cent to +100 per cent.
FLOW RATE The flow rate can be adjusted by as much as ±50 per cent.
OVEN TEMPERATURE The oven temperature can be adjusted by as much as ±10 per cent.
OVEN TEMPERATURE PROGRAM Adjustment of temperatures is permitted as stated above. For the times specified for the temperature to be maintained or for the temperature to be changed from one value to another, an adjustment of up to ±20 per cent is permitted.
INJECTION VOLUME The injection volume can be reduced as far as is consistent with accepted precision and detection limits.
Glossary of Symbols
To promote uniformity of interpretation, the following symbols and definitions are employed where applicable in presenting formulas in the individual monographs. Where a different symbol or definition is used in an individual monograph, the monograph text takes precedence. (Note Where the terms W and t both appear in the same equation, they must be expressed in the same units.)
f distance from the peak maximum to the leading edge of the peak, the distance being measured at a point 5 per cent of the peak height from the baseline.
N number of theoretical plates in a chromatographic column,
r relative retention,
R resolution between two chromatographic peaks,
Rr relative retention time,

RSD (%) relative standard deviation in percentage,
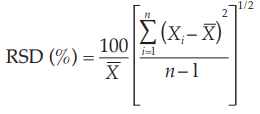
where Xi is an individual measurement in a set of n measurements and X is the arithmetic mean of the set.
T symmetry factor (or tailing factor),

t retention time measured from time of injection to time of elution of peak maximum.
tM retention time of non-retained component, air with thermal conductivity detection.
V retention volume,
V = flow rate × t
VO retention volume of non-retained component (void volume of the column)
W width of peak measured by extrapolating the relatively straight sides to the baseline.
Wh/2 width of peak at half height.
W0.05 width of peak at 5 per cent height.